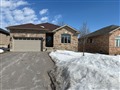
41 Cedar Dr
$591,318
Comparative Market Analysis
Jul 1, 2025
NOT AN ACTIVE LISTING
Historical Performance
| Period | $ Change | % Change |
| 1 Day | +$39 | +0.007% |
| 7 Days | -$364 | -0.061% |
| 30 Days | -$2,114 | -0.356% |
| 3 Months | -$3,080 | -0.518% |
| 6 Months | +$8,876 | +1.52% |
| 1 Year | -$34.1k | -5.45% |
| 3 Years | +$87.0k | +17.3% |
| 5 Years | +$141k | +31.3% |
| 10 Years | +$294k | +99.1% |
List My Property
Real Estate Statistics
Financing Solutions
AS SEEN ON


Are You a Licensed Real Estate Agent or Broker?